
Aging WIP
Catch at-risk work before it slips — not after.
Aging WIP is the proactive companion to the Scatterplot. The Scatterplot shows finished work; this shows your currently open work and how long it's been aging, so you can act before an item becomes an outlier.
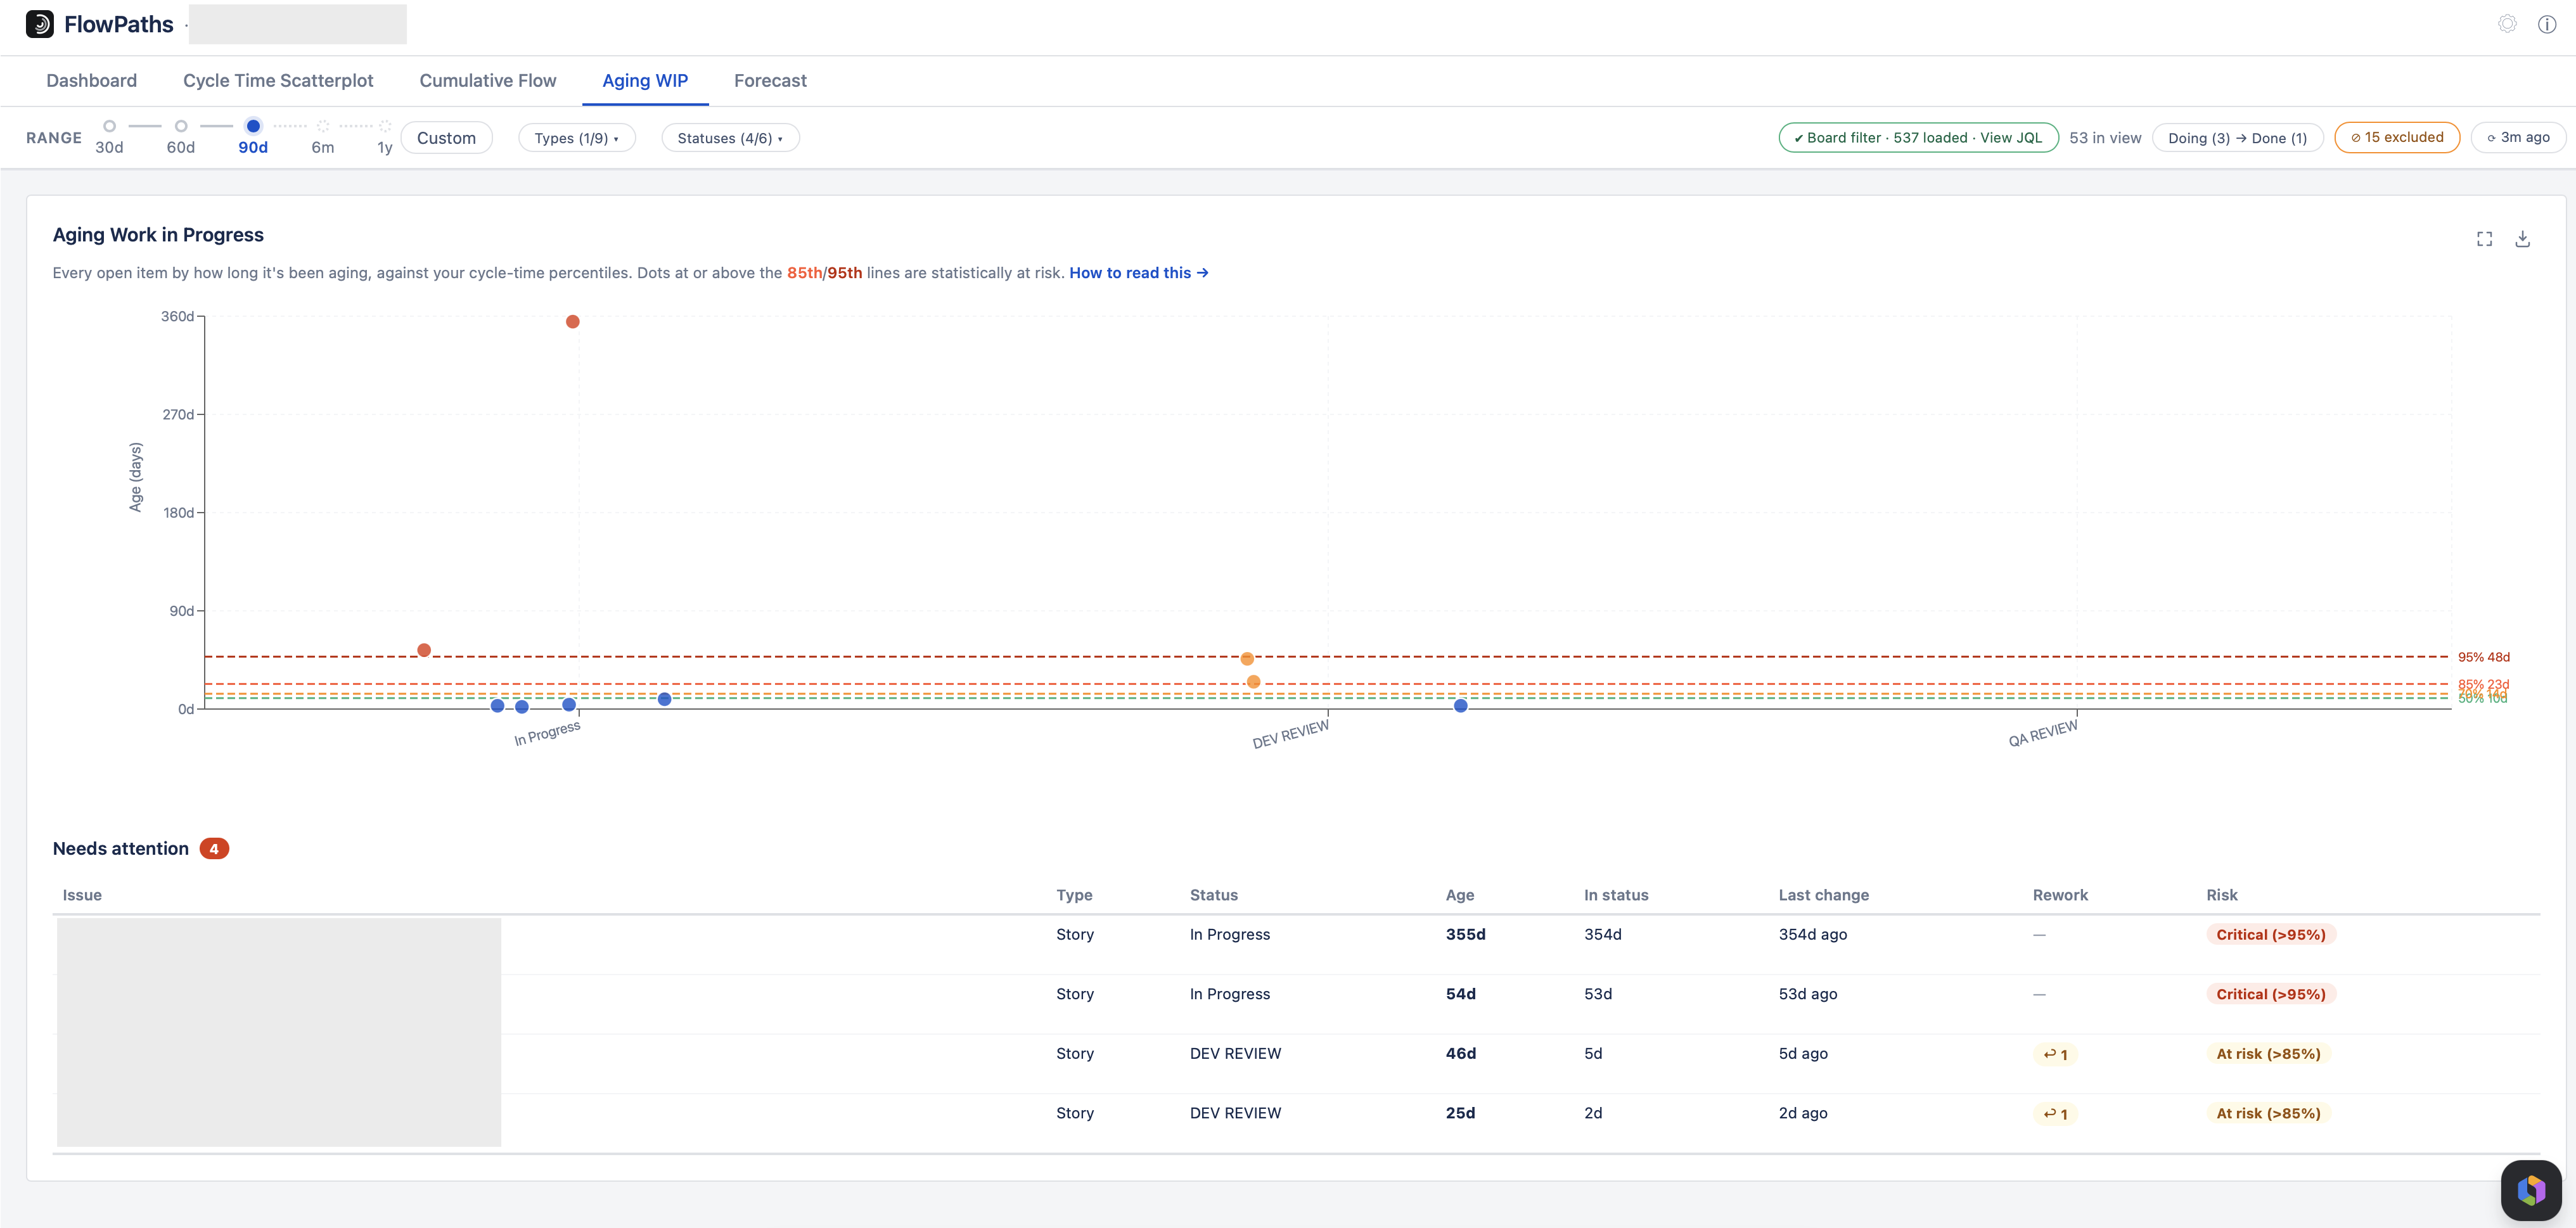
Reading a dot
- X (column) — the item's current Doing status (its lane in the workflow).
- Y (vertical) — its age: days since it first entered a Doing status (the commitment point), up to now.
- Click a dot, or a row in "Needs attention," to open its status history and rework. The issue key opens it directly in Jira.
The percentile lines are the same SLEs
The dashed 50/70/85/95th lines come from your completed cycle times — the same lines shown on the Scatterplot. An open item sitting above the 85th line has already aged longer than 85% of finished items took end-to-end, so it's statistically likely to become a slow outlier. Above the 95th line, it's critical.
How much finished work a line needs
A percentile only means something once there is enough completed work behind it. With fewer than 7 finished items, the “85th percentile” is simply the slowest one you have; below 20, the same is true of the 95th. So the 85th line and its At risk label need 7 completed items, and the 95th line and Critical need 20.
Below those counts no line is drawn and nothing is flagged. The panel tells you how many more completed items it needs rather than showing a number it cannot stand behind — otherwise a project with a single finished item would label everything older than that one item “Critical”.
Filtering by issue type
Different work types flow differently, so each type is judged against its own completed history once there are 7 or more of it. Filter to Bugs and you are compared with Bugs.
When a type has too little finished work of its own, risk falls back to your whole board’s history instead, and the panel says so. That keeps a genuinely old item flagged rather than letting it disappear just because you narrowed the view — without it, the same item could read “Critical” with all types selected and unremarkable with one, purely because of what else was on screen.
The Cycle time (85th pct) figure on the Dashboard always follows your filter exactly, because it describes the work you selected. Only the risk threshold falls back, because judging an item needs a sample that describing one does not.
Rework: returns & reopens
A return is a backward step in the workflow that didn't come from Done (e.g. QA → In Development). A reopen is a backward step from a Done status. "Backward" follows your Status Mapping order, so it even catches bounce-backs within the Doing lanes. High rework on an aging item is a strong "needs a closer look" signal — it usually means the item is churning rather than progressing.
How to use it
- It's a "right now" snapshot, not history — best used in daily stand-ups or WIP reviews.
- Work the "Needs attention" table top-down: oldest and highest-risk first. Pull these to done before starting new work.
- Items aging in a queue or hand-off status (Ready for…, Blocked) are the usual culprits — they erode flow efficiency.
- Rising age across a column over time is a sign to apply or tighten a WIP limit.
Age starts at the first Doing transition — or at the issue's creation date, if it was created directly into a Doing status.
Measuring a single stage
Untick some of the Doing statuses and items are aged by the time they have spent in the statuses still ticked, judged against completed items’ time in those same statuses. That turns this chart into “what has been sitting in review too long?” rather than “what has been in progress too long?”. A note above the chart says which statuses are being measured. See the Statuses dropdown.