
Forecast (Monte Carlo)
Answers "when will this be done?" without asking anyone to estimate.
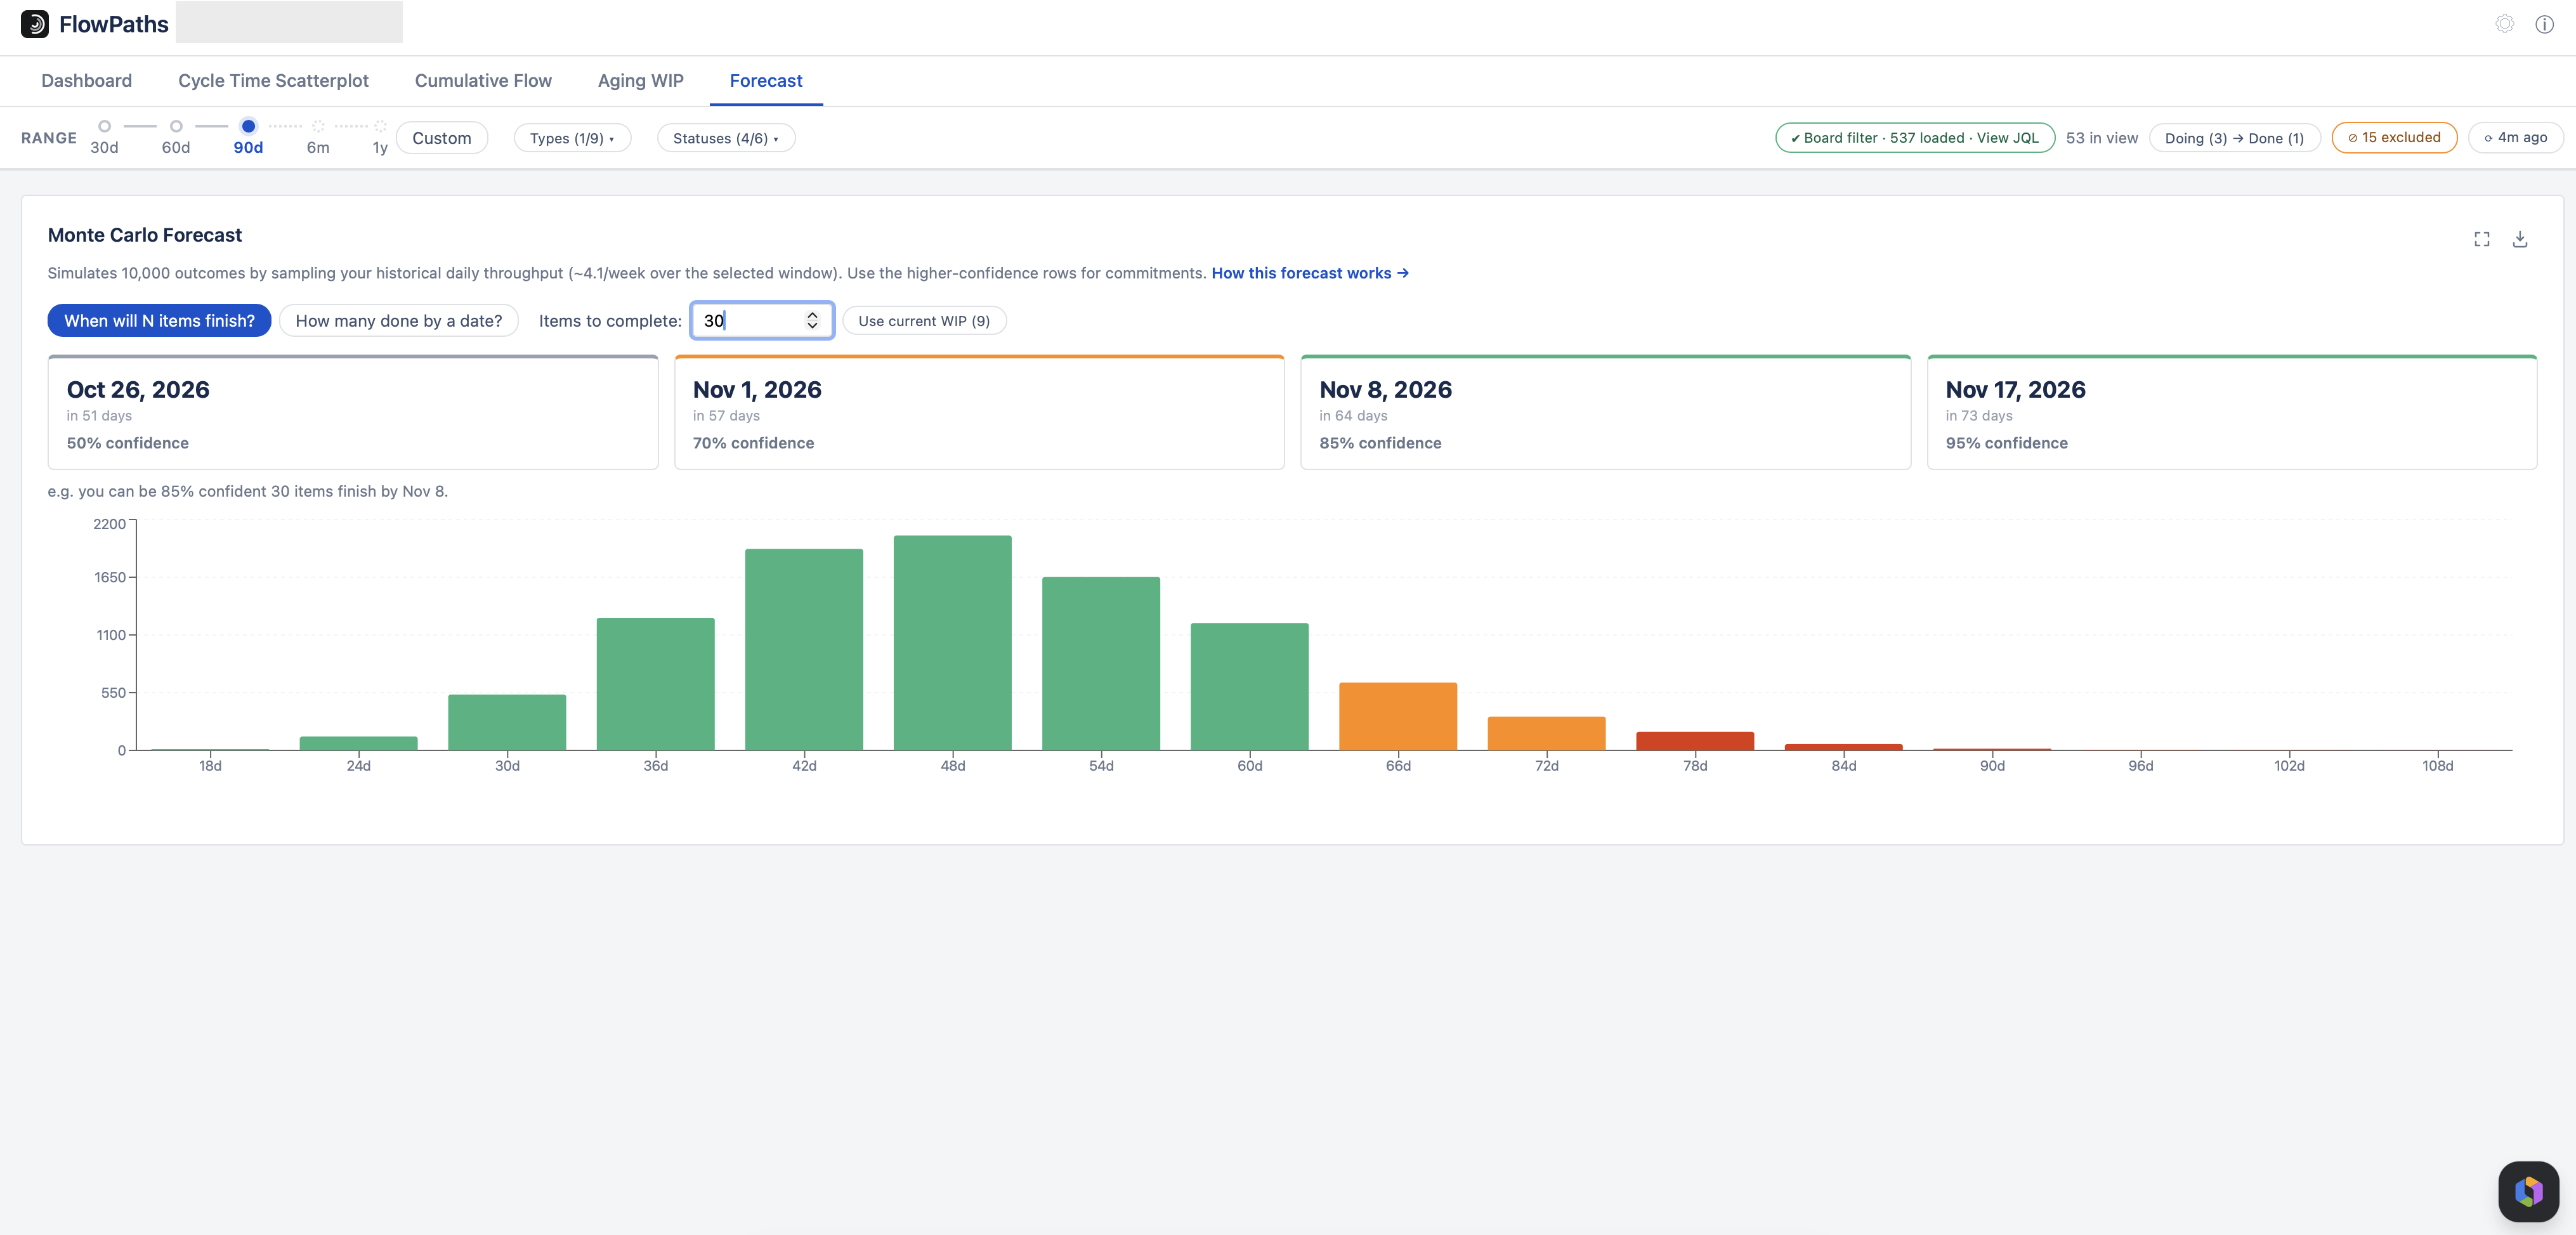
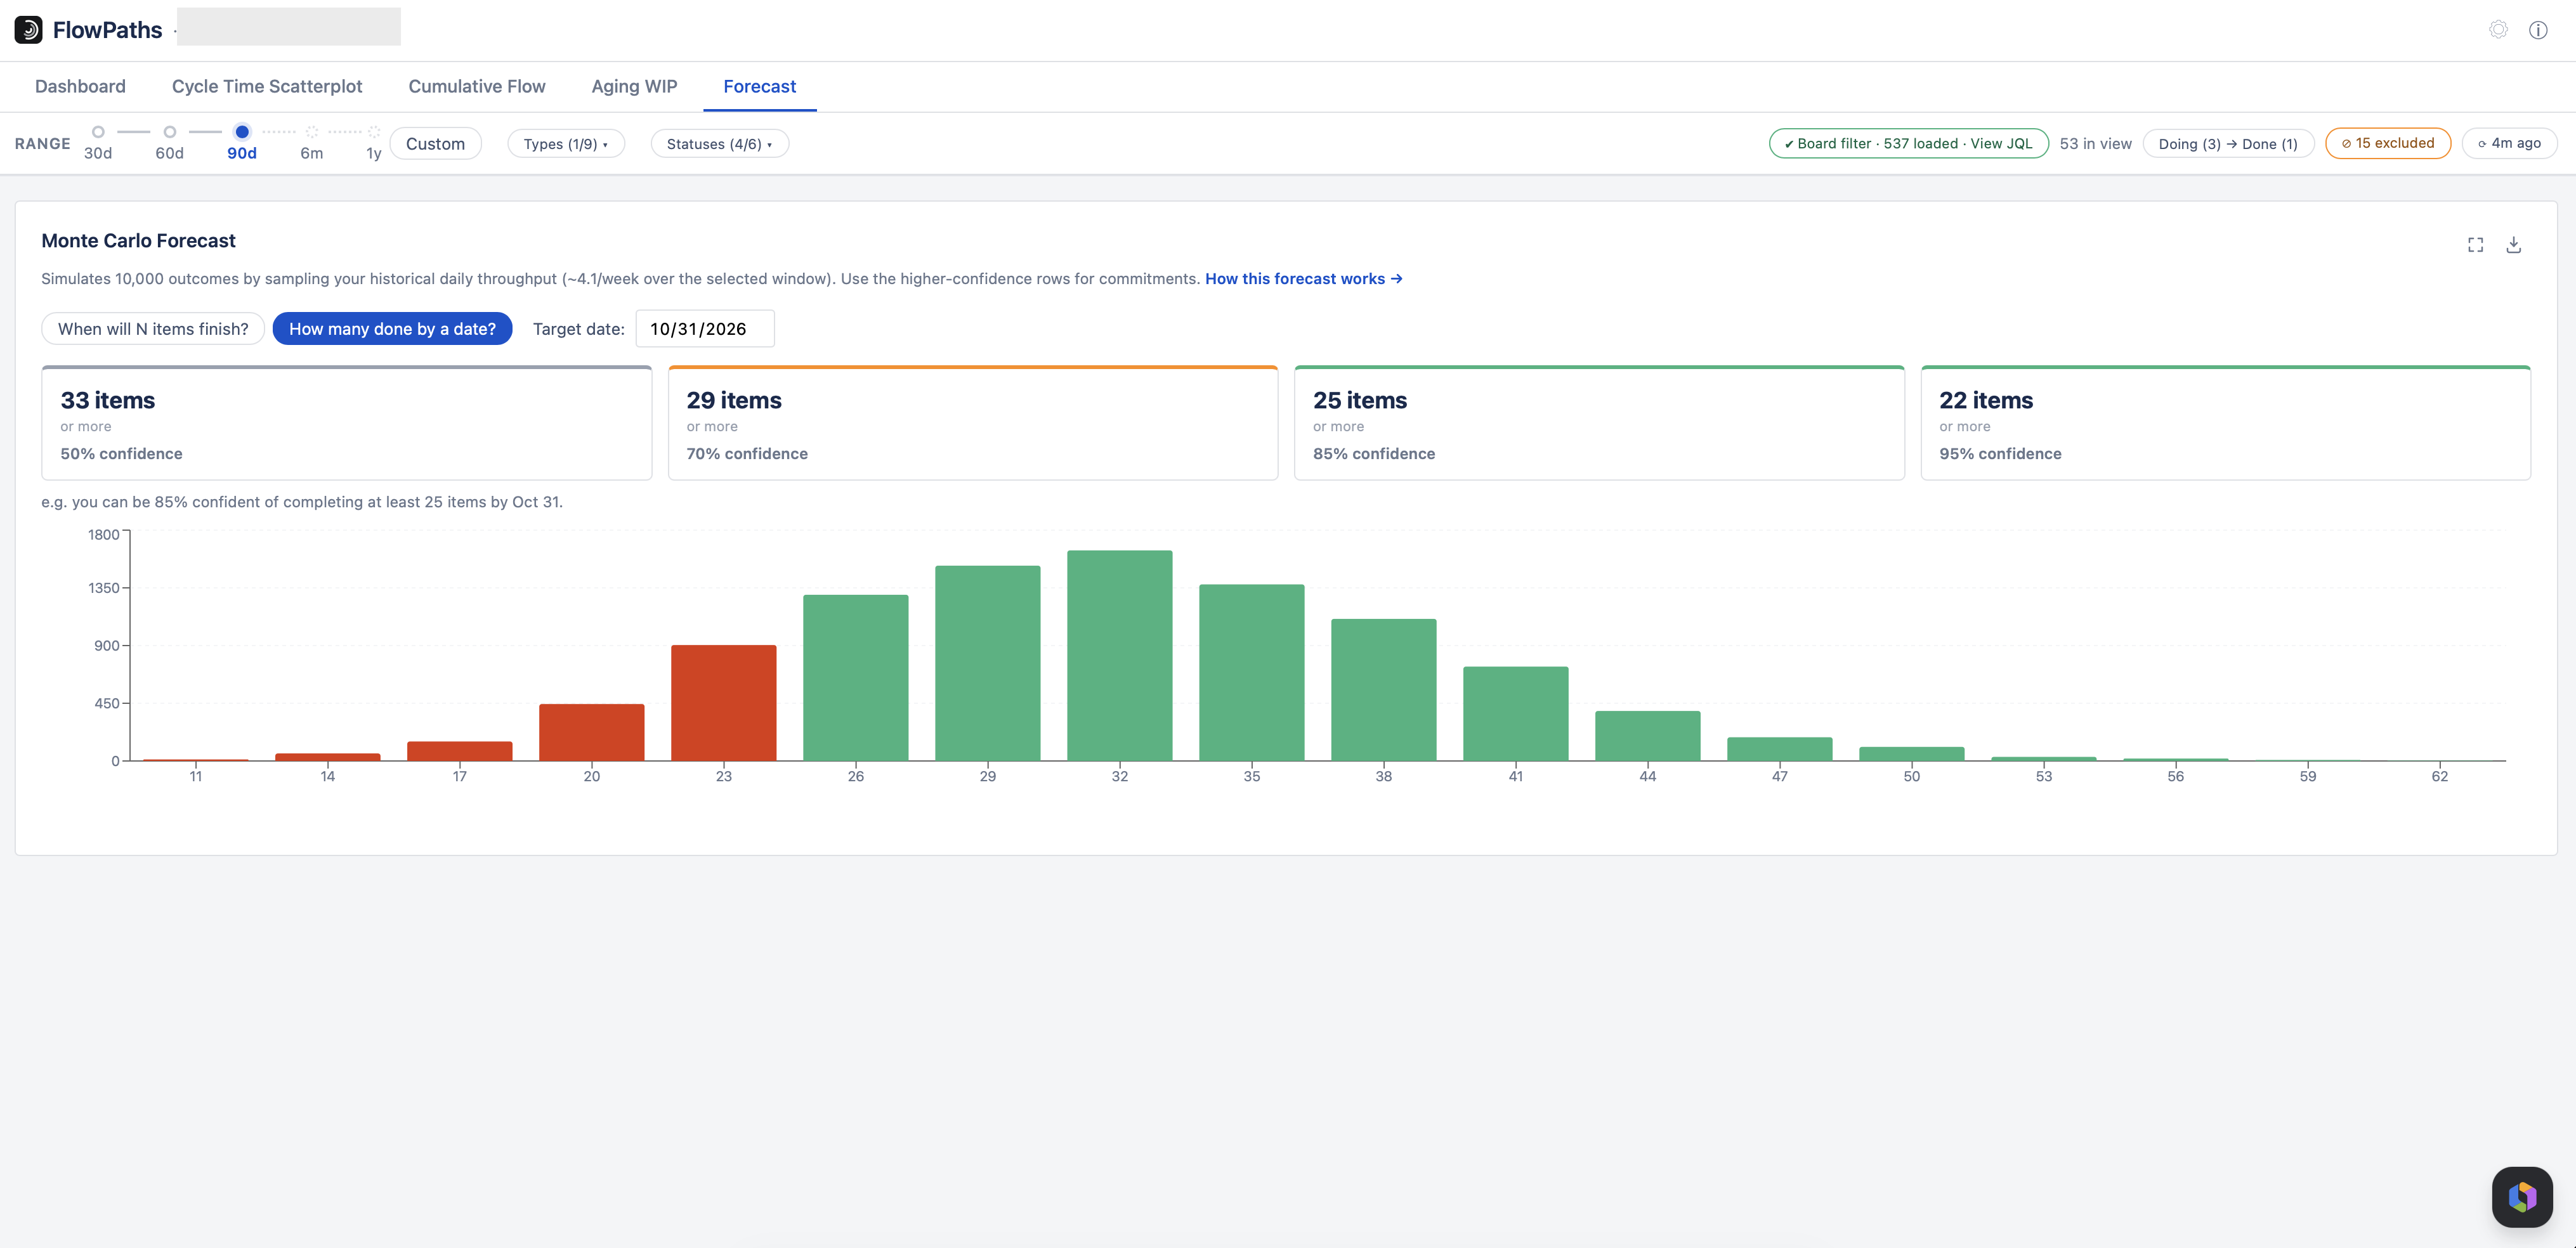
This is a Monte Carlo simulation. It doesn't guess about individual items — it replays your team's own delivery history thousands of times to see how the future might unfold, and answers two questions: "when will N items finish?" and "how many will be done by a date?"
How it works
1 · Historical sample
For every calendar day in the selected window, FlowPaths counts how many items completed (reached a Done status) — including zero-completion days. That list is your real daily-throughput distribution.
2 · Resample
Each simulated future day is a random pick from one of your team's actual past days. A "future day" in the simulation looks like a randomly chosen day from your history — not a guess or a trend line.
3 · 10,000 trials
- When will N finish? Keep drawing random days, summing completed items, until you reach N — record how many days it took. Repeat 10,000×, giving a distribution of finish times.
- How many by date X? Sum random draws over the number of days until X. Repeat 10,000×, giving a distribution of item counts.
4 · Confidence = percentile
Results are sorted, then read off by percentile.
- For "when", the 85% row is the day by which 85% of the 10,000 simulations had finished — so a higher confidence number means a later date.
- For "how many", FlowPaths reports a lower bound ("at least this many"), so 85% confidence is actually the 15th-percentile count — a higher confidence number here means fewer items, since it's being more cautious about the promise.
Use the 85% or 95% rows for commitments — the same percentiles used on the Scatterplot and Aging WIP.
Assumptions & limits
- The future resembles the sampled past — no seasonality, trends, or one-off events are modelled.
- It counts items by throughput, so every item is treated as equal size (no story points).
- Scope changes and cross-team dependencies aren't modelled.
- More history gives a more reliable forecast — very short windows give noisy results.
Forecasting a single stage
With every Doing status ticked, the forecast uses your whole throughput and answers a delivery question. Untick some, and the sample counts only completed items that passed through the ticked statuses, with the default target being the open items currently in them.